Methodify
2 years
UX Designer, UX Research
Sketch, Whimsical, Inspectlet


The Challenge

Example of initial resistance
Establishing the UX Practice
Building Foundations Through Research
Overcoming Resistance
UX research wasn’t part of Methodify’s culture when I arrived, and leadership resisted investing in it. But I knew understanding our users was essential to addressing retention issues and shaping a more effective product roadmap. To address this gap, I conducted and synthesized research using a range of methods, while also collaborating with engineering to deliver features:
web analytics
usability tests
industry reports
surveys & interviews
competitive analyses

This enabled me to create valuable documents such as user personas, journey maps, etc., which helped me build a compelling case for why Methodify needed a user-centered approach.
Revealing Actionable Insights
By synthesizing all the user data I gathered, I uncovered a few key points:
Our team had been investing heavily in the process of creating a survey/experiment, which was a non-critical area for retention
The reporting UX was by far the most critical to users, but had been neglected in favor of survey creation.

User Scenario Map showing frustrations with the previous reporting UX

User Journey Map showing how users want to use our app

Example of initial resistance
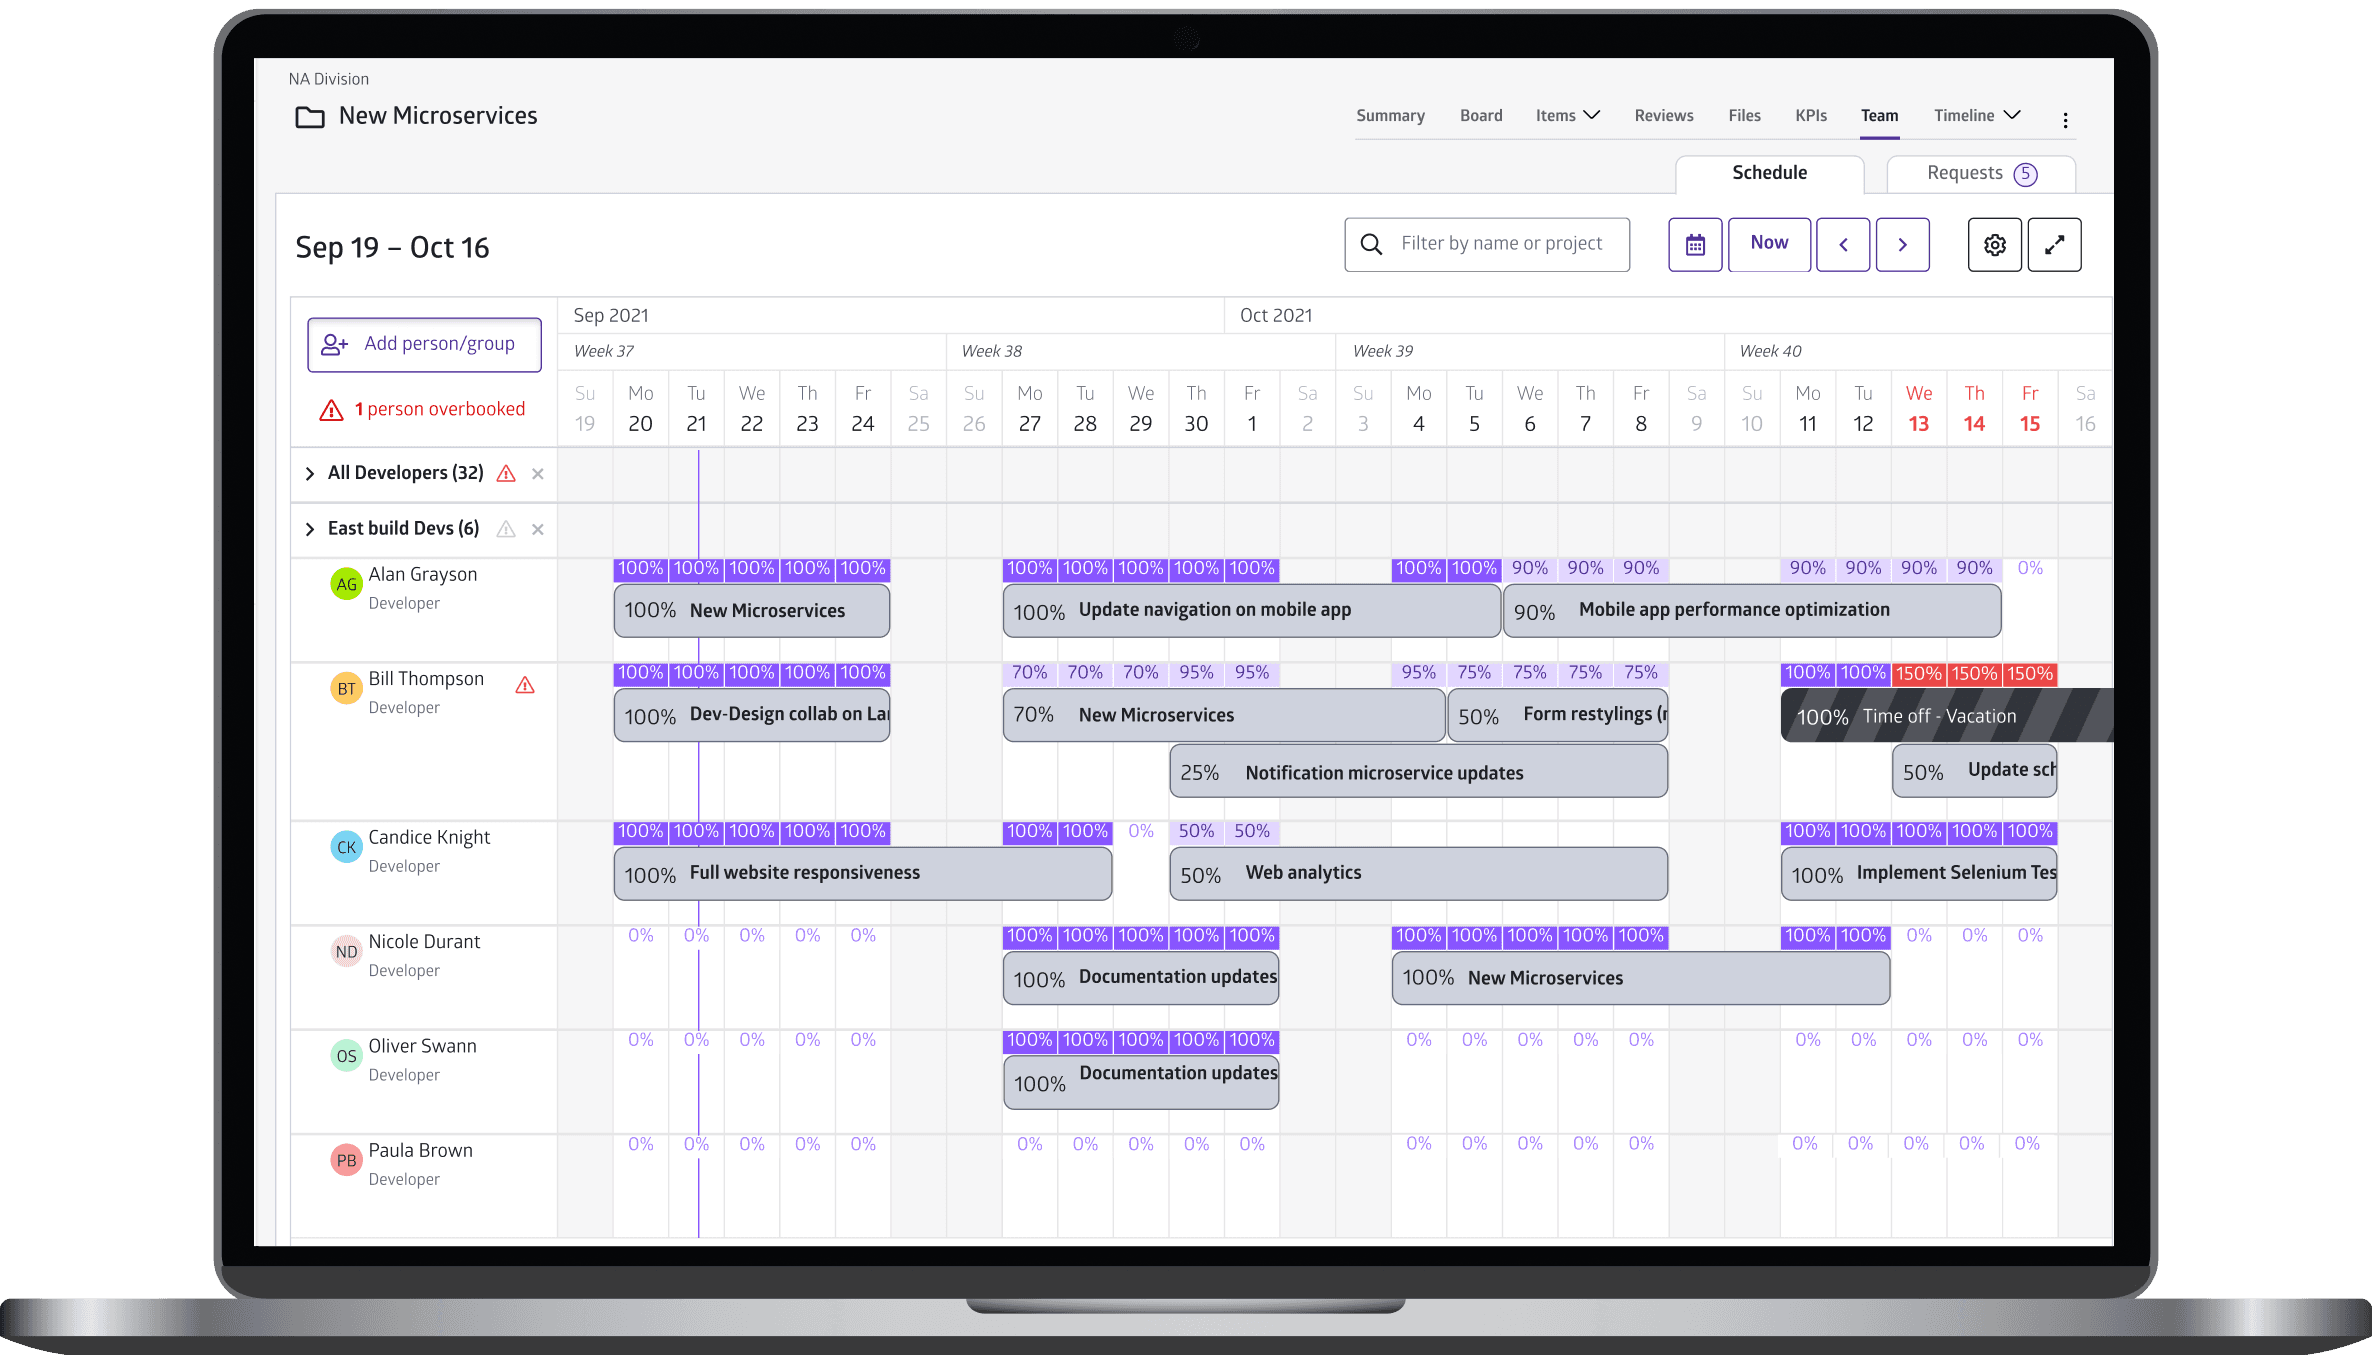
Driving Collaboration and Innovation
To bring research into action, I facilitated workshops to align cross-functional teams and brainstorm solutions. By leveraging prioritization matrices, I guided the team to focus on features with the highest user impact.
I even took on product management responsibilities, writing user stories, defining acceptance criteria, and collaborating closely with the engineering team. These efforts streamlined workflows, reduced back-and-forth, and accelerated the time to ship features.

Photo at the end of a brainstorming workshop

Prioritization Matrix used to align on high-impact features
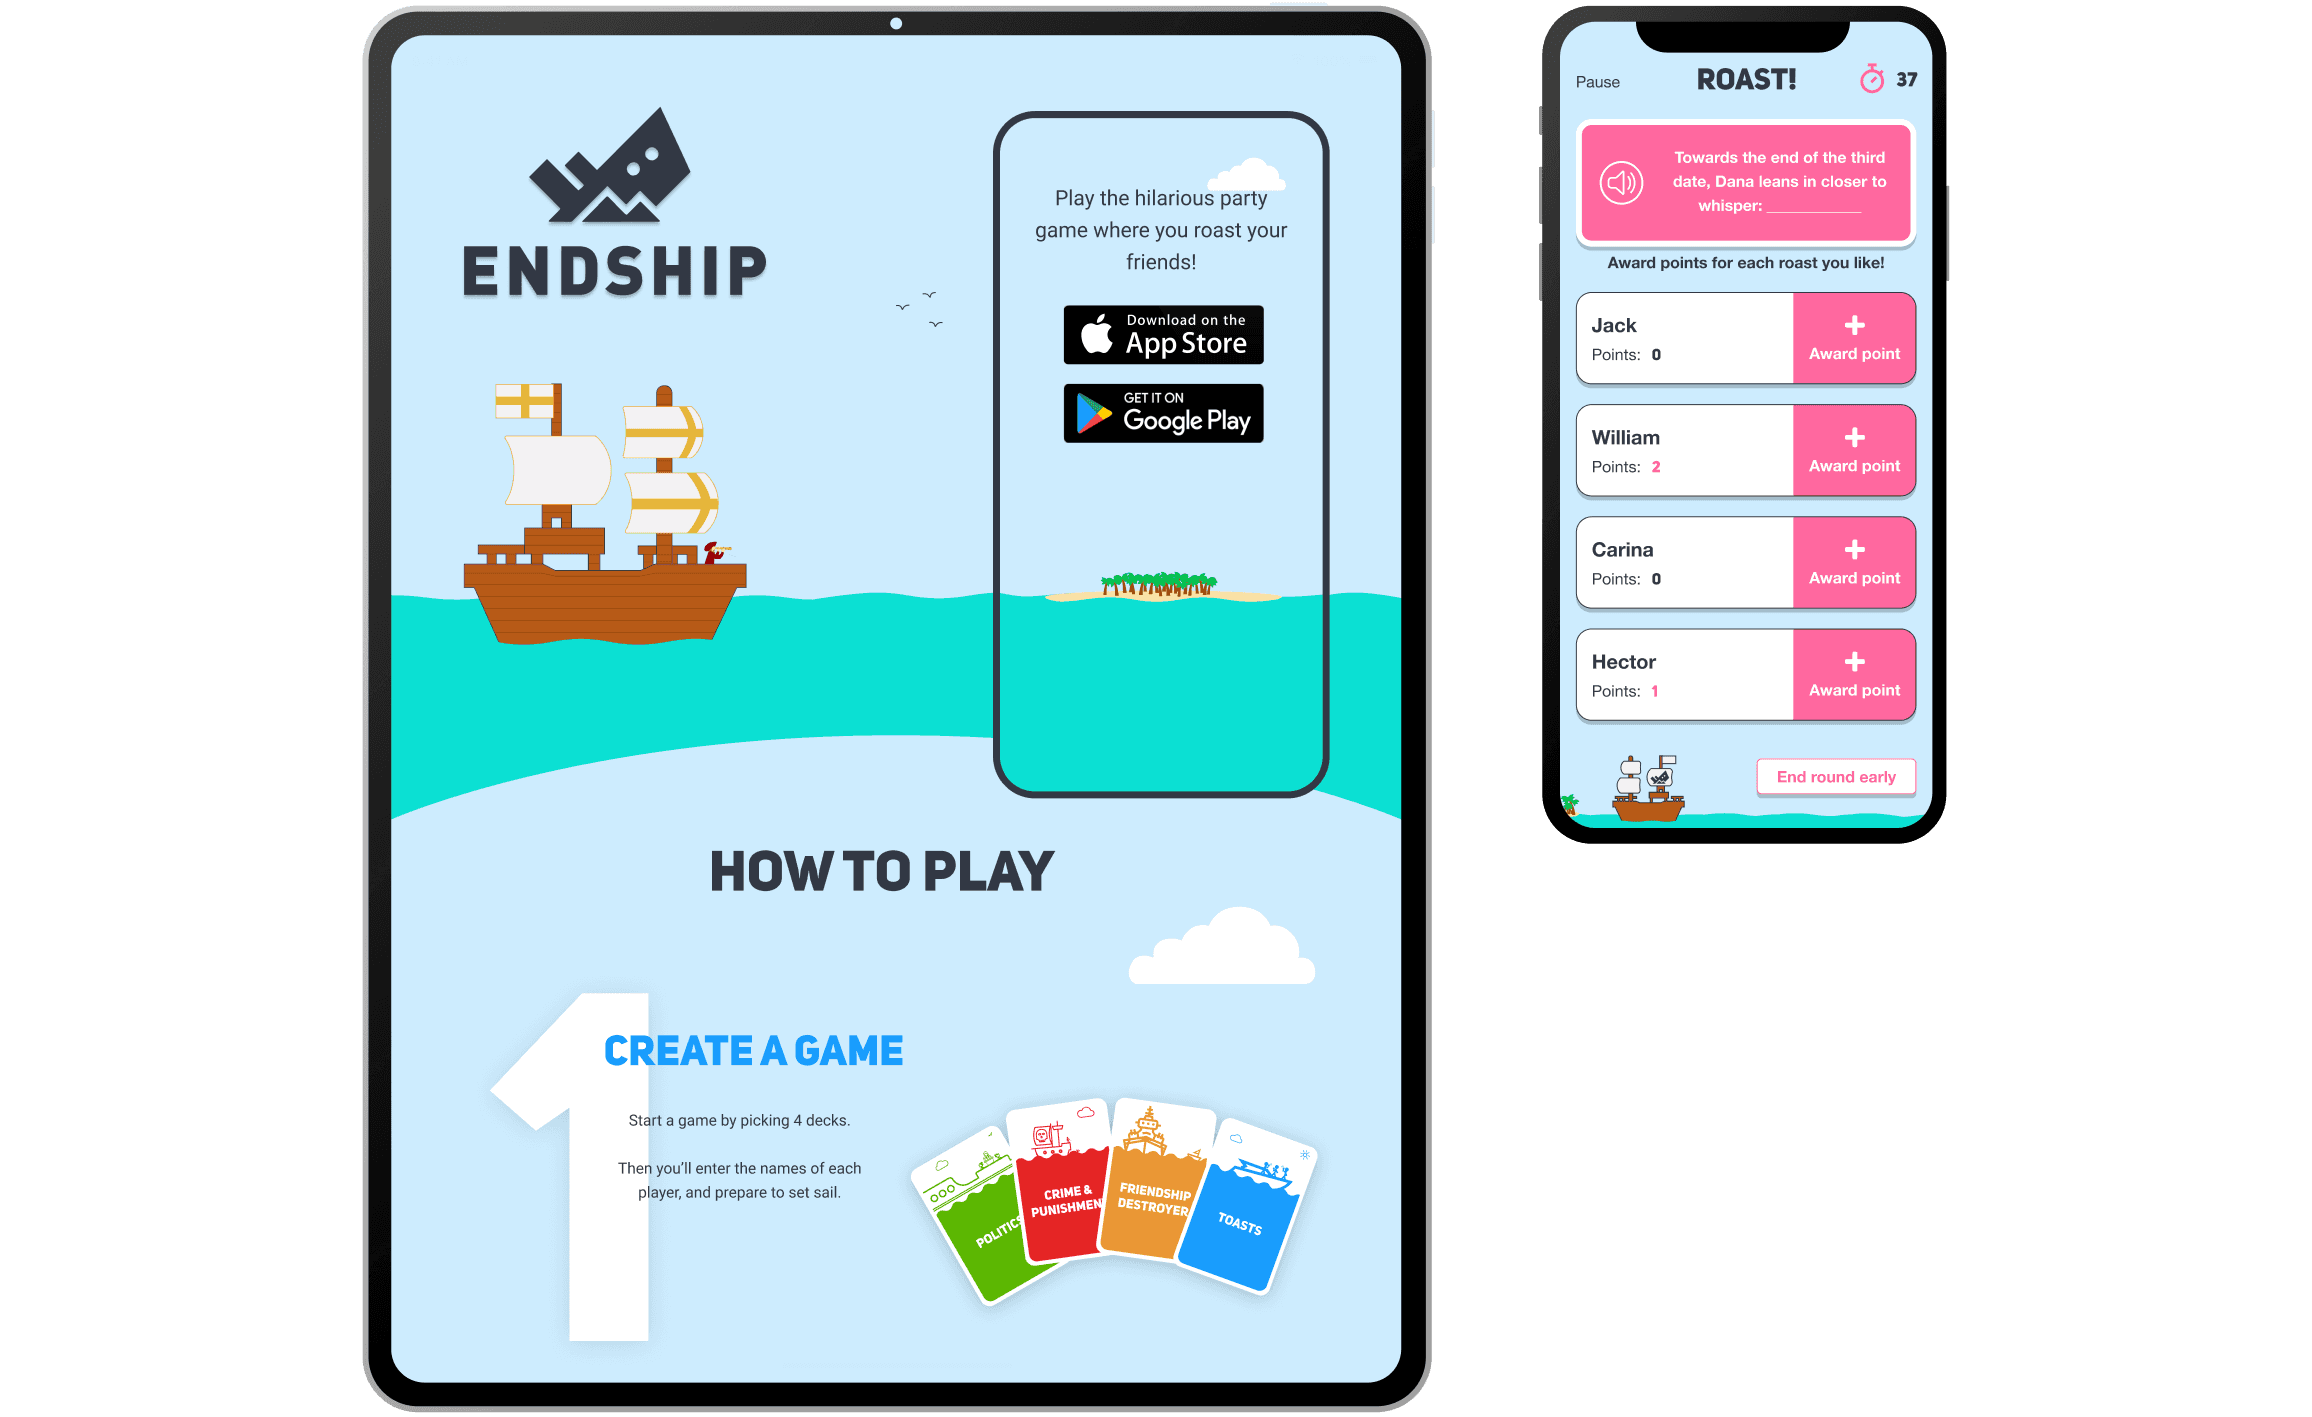
Focusing on Key Features
Although I had designed numerous features in my two years with Methodify, I wanted to highlight the work that most directly improved customer retention.
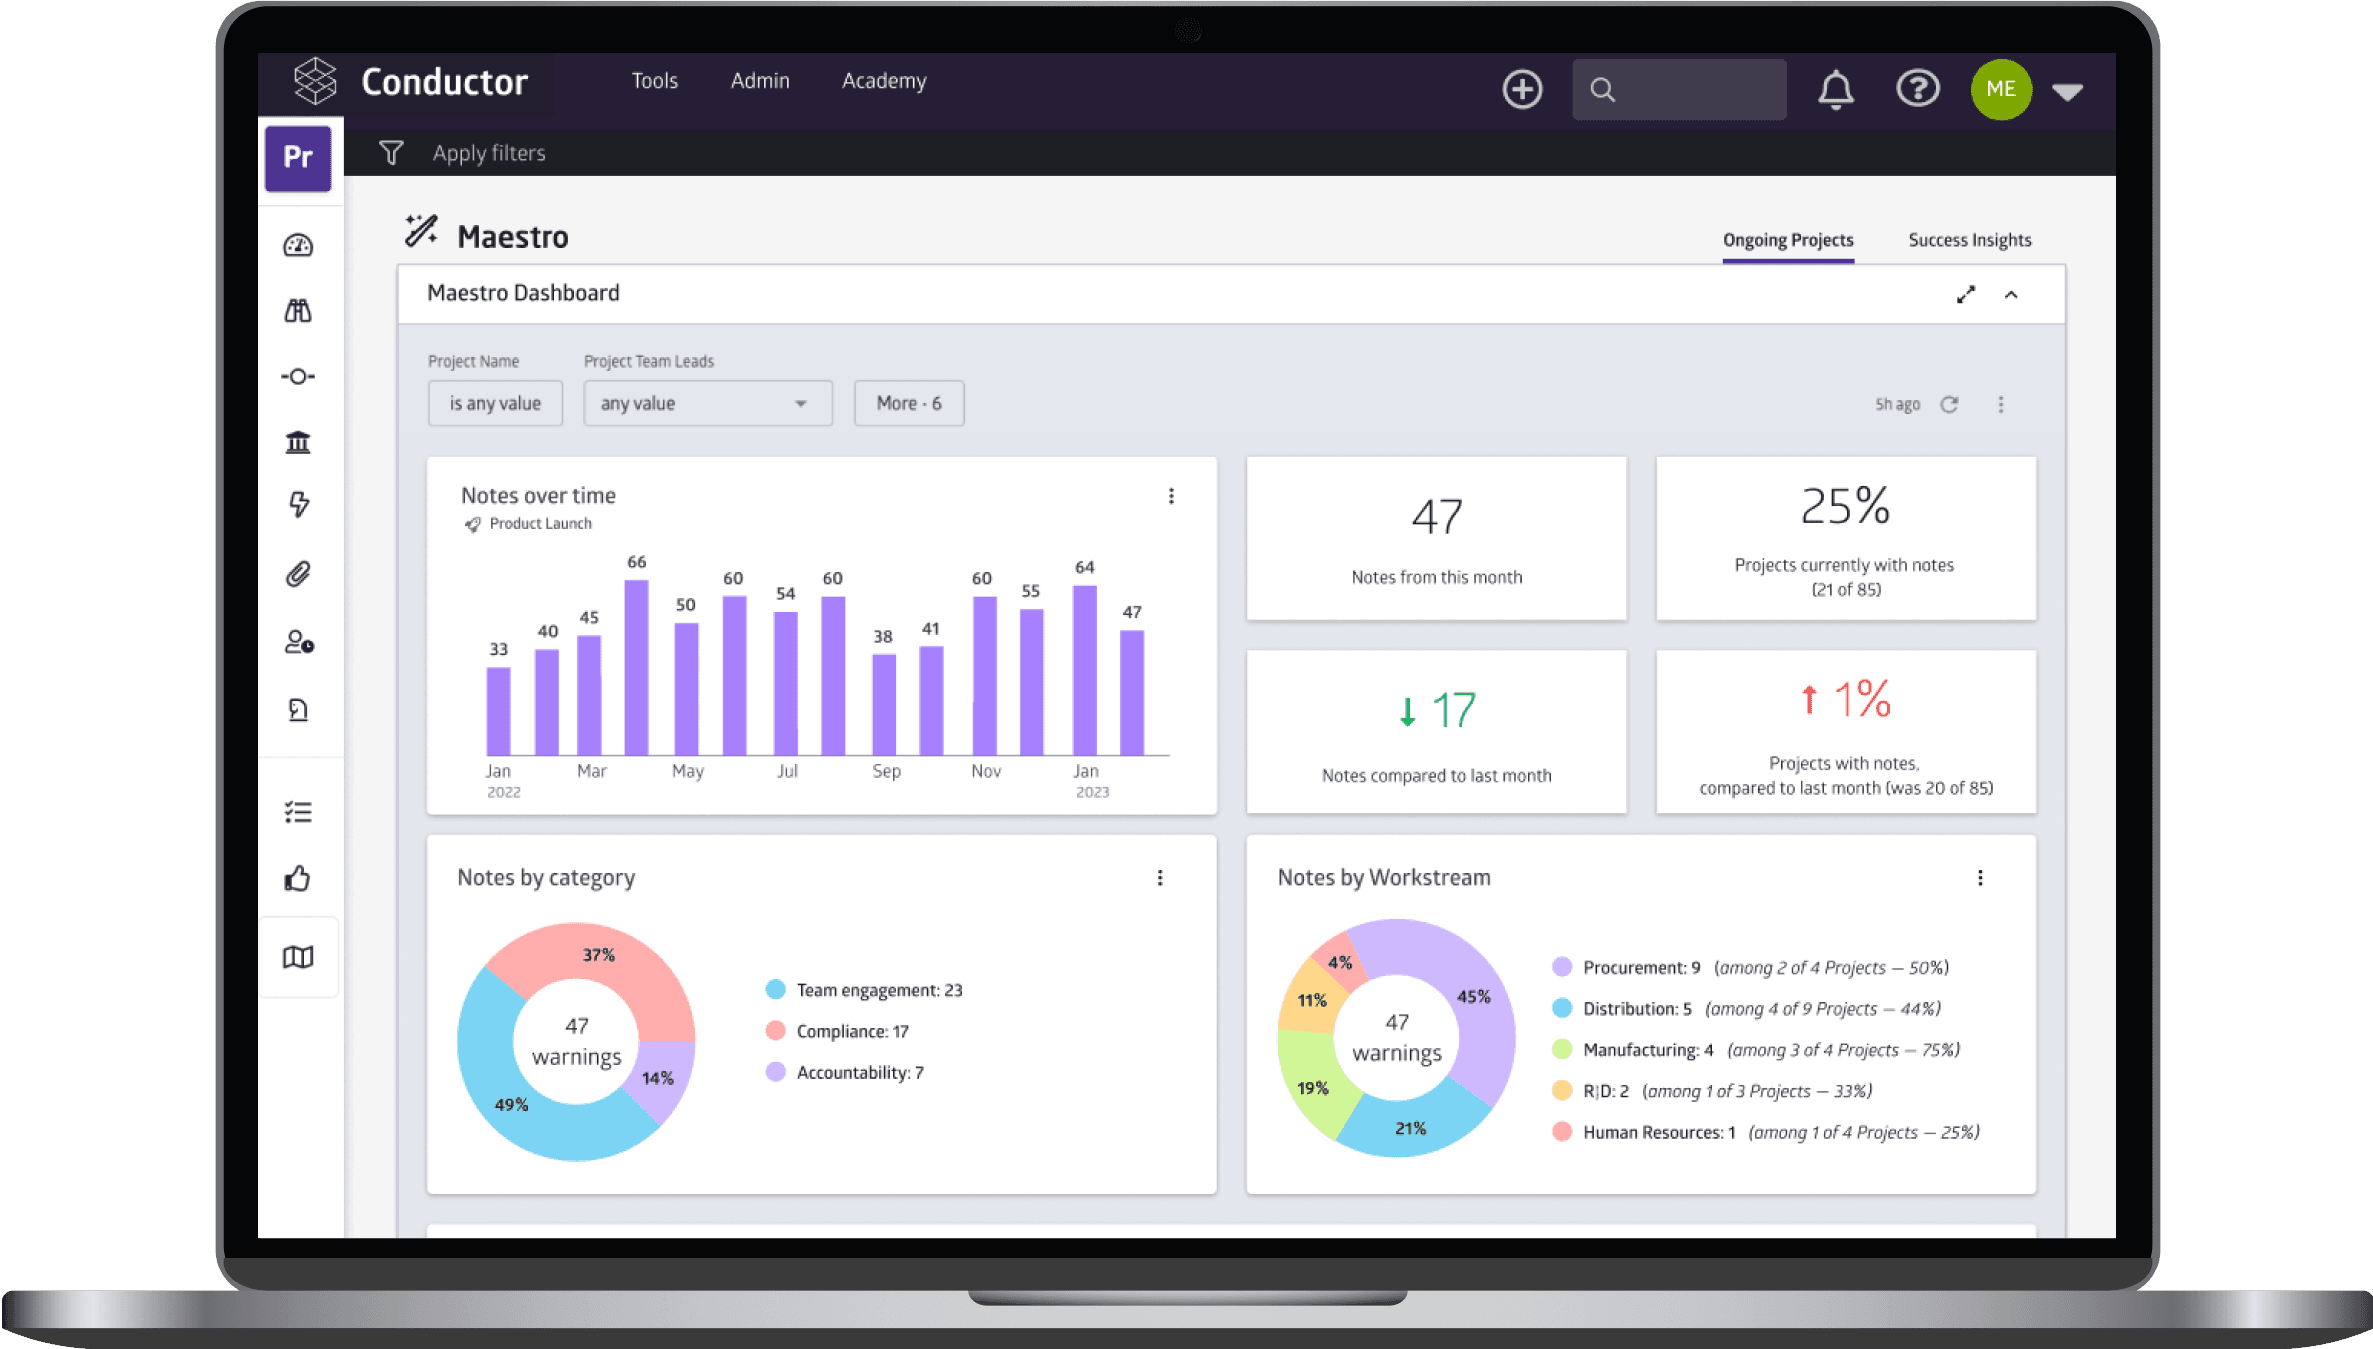
Reporting 2.0
Identifying and Solving the Real Problem
The original reporting feature was clunky, unintuitive, and failed to address user needs for data manipulation and storytelling. My research revealed that users relied heavily on exporting data to tools like PowerPoint, which created unnecessary friction in their workflows. To address this, I reimagined the Reporting UX with a focus on:
Data flexibility: Empowering users to filter, customize, and visualize data directly within the platform.
Ease of storytelling: Simplifying the creation of polished, client-ready reports.
Before diving into my process, here is a quick side-by-side comparison of the reporting page:


Designing and Validating
Before beginning my designs, I conducted a thorough UX audit and used my research findings to develop a low-fidelity prototype. This enabled me to validate the new workflowers with usability tests, and I incorporated the feedback into subsequent mockups. The redesign improved clarity, usability, and efficiency, contributing to improved customer satisfaction and retention.


Annotations of initial Reporting Page, identifying problems
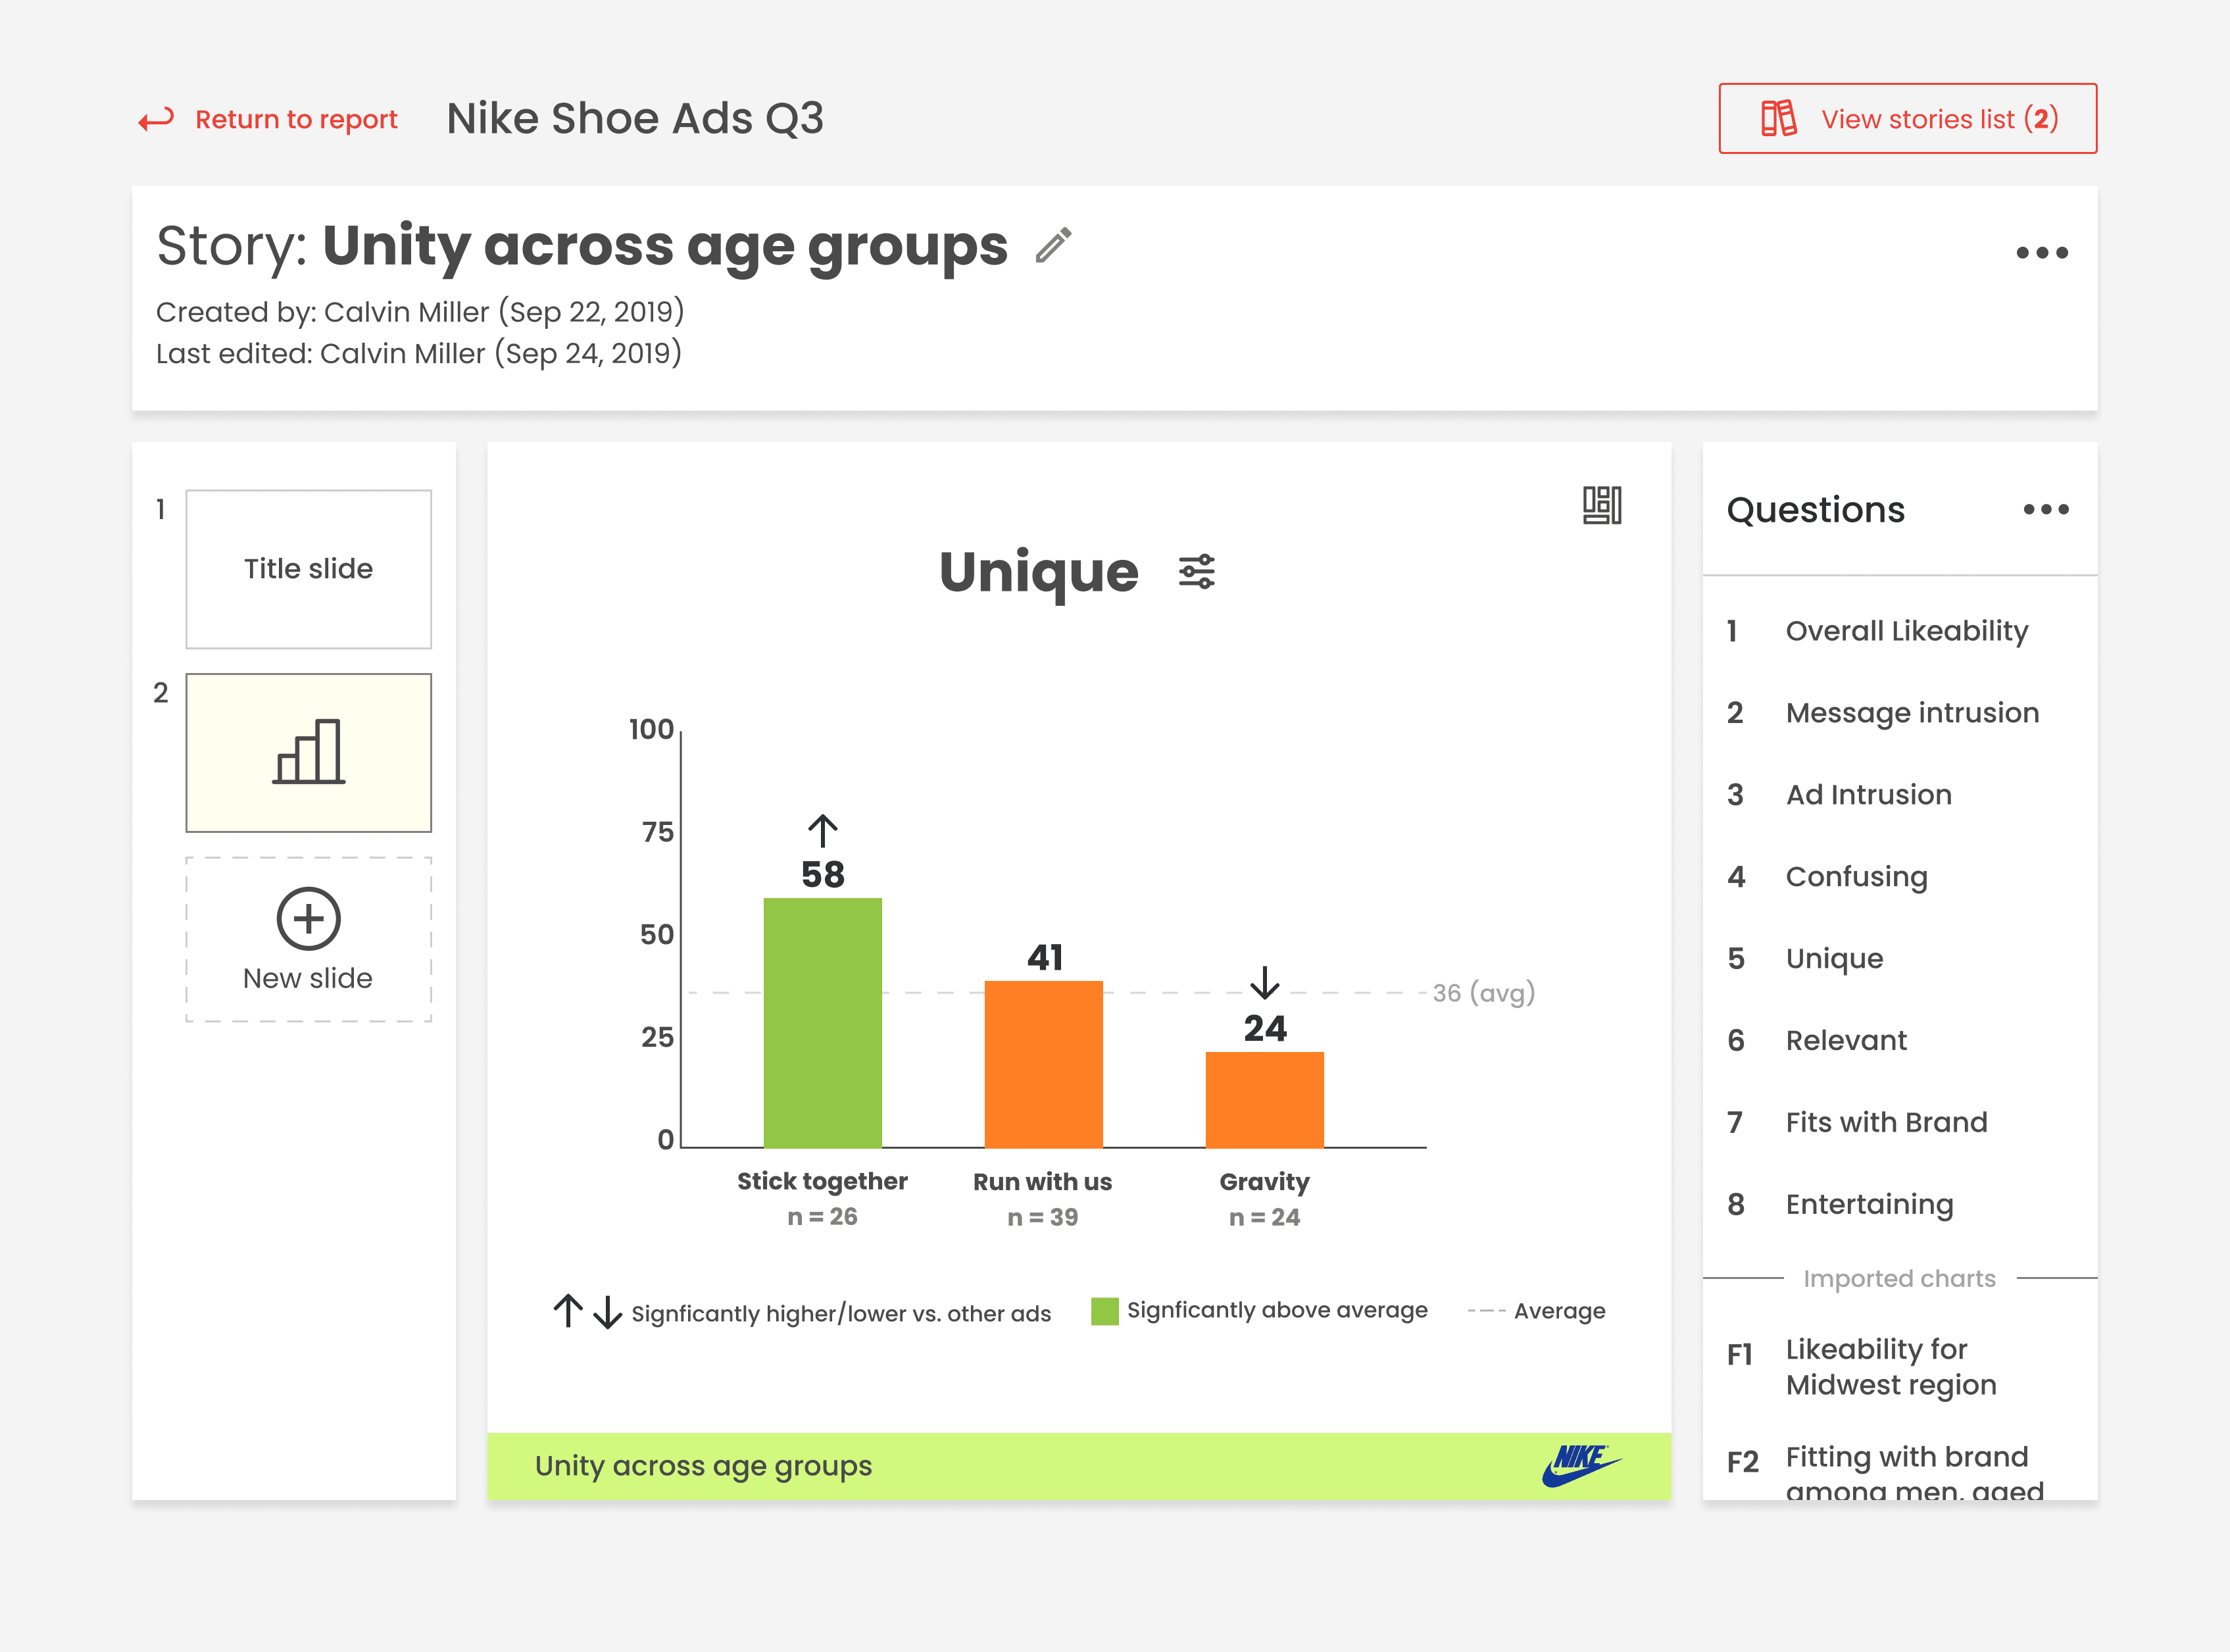
Scaling Success with Story Builder
With the foundation of Reporting 2.0 in place, I expanded on its capabilities by designing Story Builder with users’ familiarity of tools like PowerPoint in mind.
By manipulating data in Reporting 2.0, Story Builder could import such data to craft their own narratives from within the app — effectively addressing the critical user need for seamless storytelling.